I was recently given a copy of Geoffrey Martin's 1925 report The Theory of the Rotary Cement Kiln. Reading through Chapter 2, I got a kind of madeleine moment, since I recognised its contents, which were still in use in 1973, when I joined the cement industry.
When my mentor at Sundon introduced me to kiln combustion control, he showed me a dog-eared and foxed blueprint (they didn't have photocopies in 1925!) of a graph showing a relationship between kiln exhaust gas O2 content and CO content. This, as it turns out, was produced by Geoffrey Martin in the course of his report.
A persistent problem, ever since rotary kilns were invented, has been the control of the air/fuel ratio. No more air must be used than is absolutely necessary, since an excess leaves the system at high temperature and wastes energy. On the other hand, if there is too little air, the carbon in the fuel burns to carbon monoxide, or even leaves the kiln unburned. This is undesirable for a number of reasons:
- Burning fuel to carbon monoxide instead of carbon dioxide realises only a fraction of the fuel's energy potential.
- Reducing conditions cause quality problems in the clinker product, which must be kept fully oxidised at all times.
- Reducing conditions encourage cycling of sulfur in the kiln, causing "rings" and blockages.
It might be imagined that there is a "sweet spot" in the air/fuel ratio where the amount of oxygen is exactly that required to convert all the carbon to carbon dioxide, so that the exhaust gas contains neither carbon monoxide nor oxygen. However, in practice carbon monoxide and oxygen coexist in the exhaust gas, for two main reasons:
- mixing of fuel and air is incomplete in the brief period during which they are at combustion temperatures, so that carbon monoxide may not entirely burn out before it leaves the kiln, even when there is substantial surplus oxygen.
- the air/fuel ratio, although it may be controlled exactly to the stoichiometric value on average, is necessarily variable from second to second because of the way the fuel is fed, and so the exhaust is always a mixture of over-fuelled and under-fuelled gases.
This was the context in which I was introduced to Martin's graph. Particularly in Blue Circle's Midland Area, wet process kilns had been converted to automatic combustion control. All Midland Area kilns had control loops in which the fuel feed rate was automatically varied to maintain a constant back end oxygen level. This operated effectively, even at antiquated plants like Sundon, drawing a straight (if fuzzy) line on the oxygen recorder, disturbed only by occasional small (0.1% or so) changes in set-point to keep the kilns in line. However, the question still remained: what was the best oxygen set-point to use? My Cement Technology Course was held at Gravesend, and I was given the mission by the Sundon manager to observe carefully the oxygen levels being used when the course group visited Northfleet. I was able to report back that, of the six identical 1800 t/d kilns, two were stopped, and of the four that were running, two had oxygen levels off-scale (i.e. greater than 5%) and the other two were reading flat zero. It was this, among other intelligence gathered on that course, which, at this early point in my career, convinced me that people from the "cradle of the cement industry" had little to teach the world about how to make cement. In time, I realised that this is a small part of a more general principle: that a "Best Practice" can only be demonstrated by showing objectively (and repeatedly) that the practice actually is better than any other - it can't be achieved by mere fiat.
My report-back on this topic at Sundon was greeted with general mirth.
Historically, in early rotary kilns, the combustion control problem was more severe than in modern kilns, because the kilns were short, and it was necessary to drastically restrict the air supply in order to concentrate heat in the hot end of the kiln. The lack of any instrumental means of assessing the composition of the exhaust gases made kiln control a hit-and-miss affair, even in the hands of an expert operator. "Best practice" as late as 1930 is described by William Gilbert thus (Note 1):
It is found convenient to regulate the air supply to the kiln in accordance with the colour of the discharge from the top of the chimney. The air is cut down until a slight discolouring is noticed in the steam. . . . An opening is made, if necessary, in the roof of the burning platform so that the burner at the kiln hood may keep the chimney top in view.
The fuel was increased (or the draught reduced) until the stack plume just began to darken. Because of the short kiln, this did not necessarily mean that the air/fuel ratio was below stoichiometric. There is a persistent urban legend regarding the 18-metre Kiln 1 at Sundon: when in operation, there was always a pale blue flame emerging from the stack. And this was the longest-lived of the first-generation kilns - it ran, with adequate success, for more than 20 years.
As kilns were lengthened after 1907, there was more generous room for the burning zone, and the air/fuel ratio could be allowed to rise. Since, in the absence of any excess air measurement, there was no obvious limit to this dilution, the longer kilns became characterised by excessive gas volumes, and companies were disappointed to find that the promised economies of longer kilns were not realised. When the APCM kiln research programme began in 1914, this anarchic attitude to combustion control soon became apparent.
Quantification of the problem began with a systematic use of analysis of the exhaust gases. The technique universally used was the Orsat gas analysis apparatus.
The Orsat gas analysis apparatus was patented by Louis Hengist Orsat (1837-1882) in 1873, and was used by him mainly for analysing furnace exhaust gases to establish combustion efficiency. The apparatus was gradually modified over the years to analyse a wide range of gases, but for work in the cement industry, only the simple, original form was needed, analysing for CO2, O2 and CO. It was applied to rotary cement kilns in the USA from the 1890s, but seems not to have been used in the UK until the APCM kiln test program began in 1914.
Continuous reading instruments giving gas analysis data began to appear in the mid-1920s, but before then analysis techniques such as the Orsat were all that was available. The normal process was to analyse a sample of gas accumulated over a fairly long period - up to as much as eight hours. Such a frequency had little use for control of a kiln with a 2-hour residence time, and since it referred largely to the previous shift, the control conditions under which it was produced were anyone's guess. However, as an alternative to no data at all, the information was used to get a broad impression of average combustion conditions.
In the sequence of "kiln tests" begun in 1914, more frequent testing was done, at a rate of 3-4 per shift. The 29 tests during the period resulted in a total of 2139 data sets, and these were the data used retrospectively by Martin to derive a model relationship between the oxygen and carbon monoxide values. Later tests by BPCRA achieved a 20-minute frequency by using multiple Orsats.
The dataset used had a number of inherent problems:
- In assessing the relative amounts of oxygen and carbon monoxide, any oxygen not properly absorbed is instead read as carbon monoxide. Thus, for any given oxygen level, the carbon monoxide level tends to be higher than is really the case. This bias is greater if there is pressure to "get the results out quickly". Since Martin at no point even mentions the possibility of errors, bias is neglected in the interpretation of the results.
- Gas samples were always averaged over a fairly long (but variable) time base, so that any sample could always be a mixture of over-fuelled and under-fuelled gases, hence exaggerating the tendency of oxygen and carbon monoxide to co-exist.
- The dataset included a wide variety of kilns of L/D varying from 9.5 to 30, both dry and wet process, with widely differing combustion conditions and control regimes.
- There was a wide variety of arrangements for providing kiln draught. All the kilns tested had natural draught (i.e. that produced only by the convective effect of the stack) but some had their own stack, while others shared one. Some stacks were no more than 15 m high, while some reached 90 m. A few kilns had pressurised coolers. These factors affected the availability, stability and adjustability of the air supply.
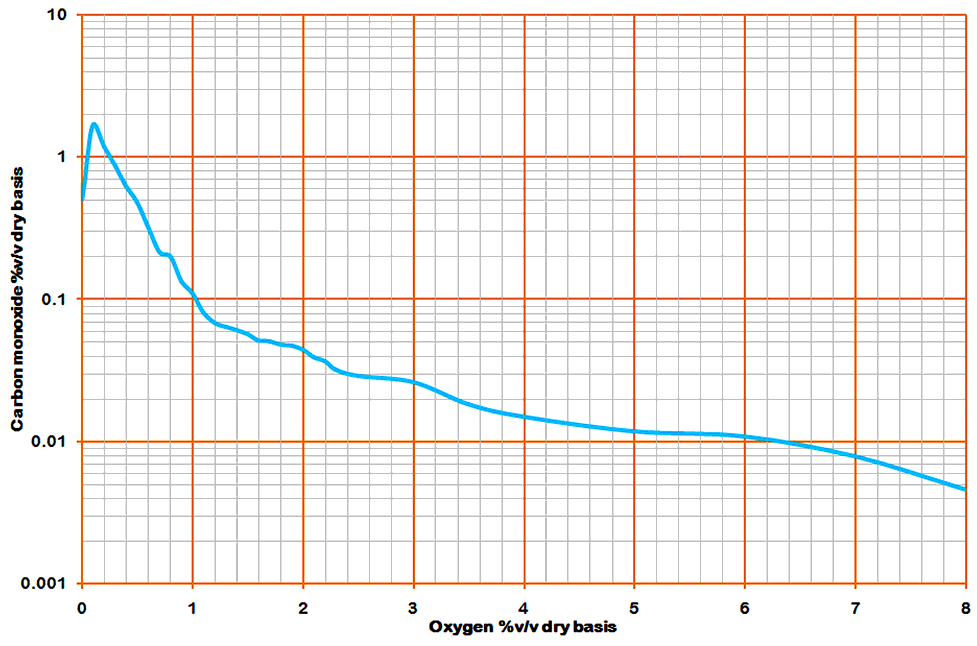
Nevertheless, Martin analysed the data in an admirable manner. He described it as a "terrible bit of tedious labour", which it must have been, considering the fact that it was done by indexing thousands of manuscript reports and calculating by pencil and paper. Modern computing allows a much more detailed analysis in a few hours' work once the raw data has been digitised. He did what amounts to a cohort analysis, in which datasets with a common oxygen value are grouped together and the average carbon monoxide calculated. Since Martin was clearly no fan of error theory, he gave no indication of the very substantial standard deviation of each average. These data were then presented in table form, and as a graph, which looked like this:

Note the logarithmic scale. Martin immediately drew attention to the "curious" fact that the CO seemed to drop off at very low O2 levels. He explained it (as he was wont to do) as an artefact of the operators' control strategy. This intuitively seems a daft explanation, and on closer study it is found to be every bit as daft as intuition suggested. Obviously there's no knob you can turn to turn off the rules of stoichiometry. The real reason for this drop was that the kiln was so short of air that there was insufficient even to make CO, and unburned coal went up the stack. On the early, short kilns, black smoke was practically a normal condition.

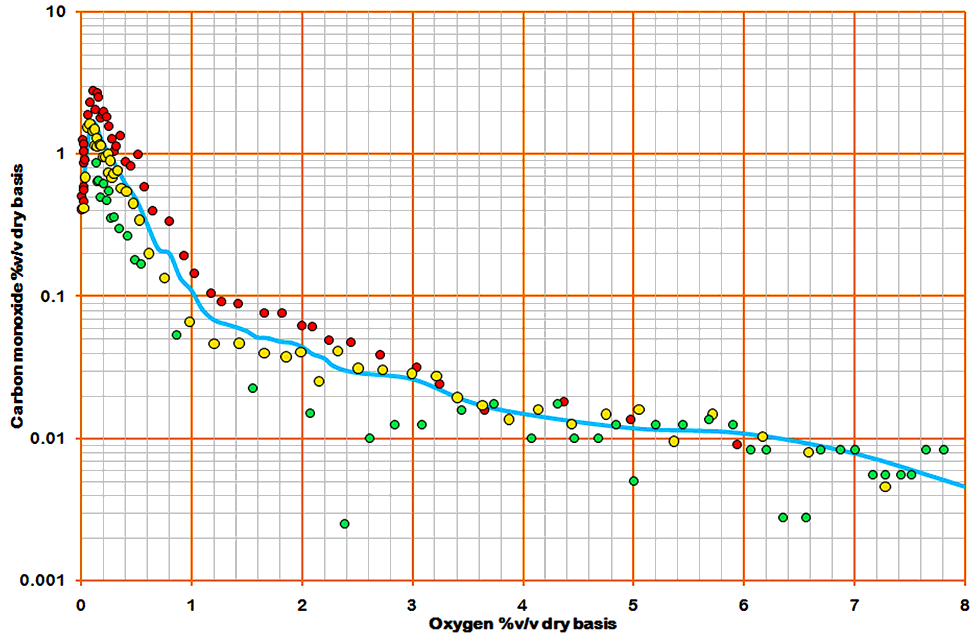
Returning to the raw data, it is possible to break out some of the causative influences - for instance the L/D ratio of the kilns. The method consists of splitting the data into three L/D cohorts, then splitting each of these into equal O2 cohorts. The mean CO values of these cohorts are shown along with the original line thus:
In the graph, the red dots represent kilns with L/D ratio less than 17.5 (about a quarter of the data). The yellow dots represent kilns with L/D ratio between 17.5 and 23 (about half of the data), and the green dots represent kilns with L/D ratio greater than 23 (about a quarter of the data). The degree of scatter attributable to this one variable is obvious. The longer kilns show a distinct trend to lower CO levels.
It should be clear by now that the relationship shown in the graph represents a snapshot of the situation when rotary kilns had only been in use for 15-20 years. The equipment technology was still immature, as was the culture of operational practice. There was almost no instrumentation, and the few hands-on controls were primitive. As such, it was not applicable to later conditions. Oxygen metering giving an almost instantaneous reading transformed control from the 1930s onward, allowing fuel supply to be controlled much more exactly, reducing the frequency of "CO-spikes". Longer kilns with better mixing became the norm. By the 1970s, the relationship in the graph was distant history. However, the general princple, that the probability of CO generation increases rapidly at low oxygen levels, remains true for all kilns.
Martin's motivation, in deriving the relationship, was to arrive at a definite optimum operating level for kiln exhaust oxygen. This involved calculating separately the fuel cost of the excess air and the cost of the related carbon monoxide, then adding these together. Martin's calculations were hampered by a lack of knowledge of atomic weights and of the composition of air (Note 2) - defects which would be reprehensible in any other industry, since by 1914 the internationally accepted values of these data had settled down close to the modern values, and could be found in any source of "general knowledge" (Note 3). There are also a number of logical errors, such as the assumption, in his example calculation, that the gas CO2 content remains constant: clearly this can't be the case when the excess air content varies over a wide range. Martin bequeathed these errors to his successors. In the 1970s, errors in the standard calculation proformas were instantly recognisable to a graduate chemist, and persuaded me at least always to ignore prescribed methods and to proceed from first principles. This was easy enough.

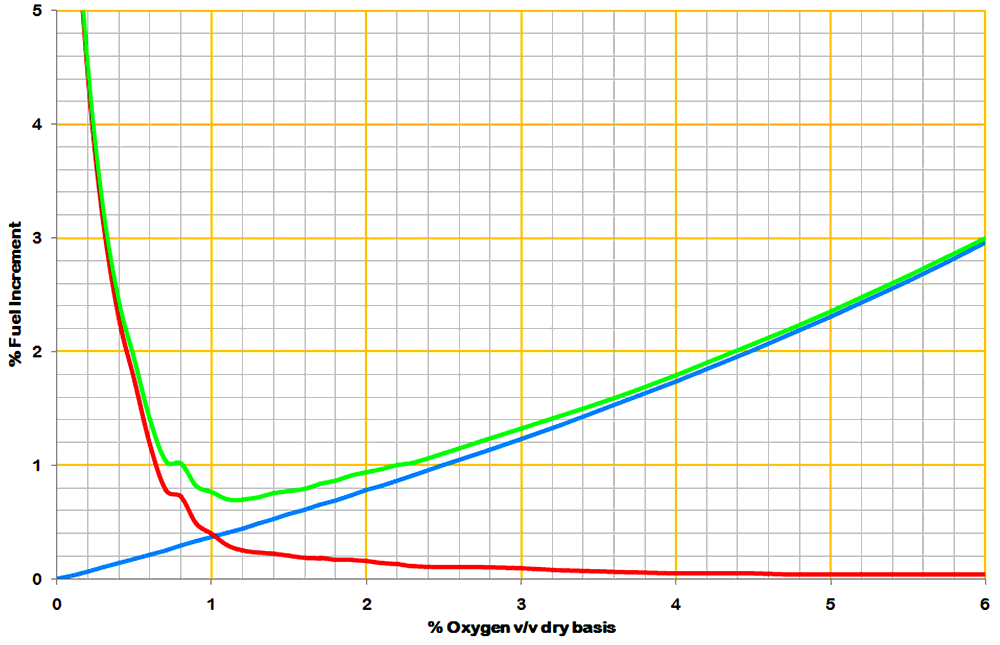
The effect of the excess air is straightforward, and is obviously roughly proportional to the oxygen content, and also to the temperature of the exhaust gas relative to ambient. Martin's calculations contained a number of minor errors resulting in a slight over-estimate. The blue line shows a typical correct calculation, based on a kiln heat consumption of 7.03 MJ/kg, using bituminous coal, with an exit temperature 200°C above ambient, the cost being expressed as the percentage increase in fuel relative to the base condition (O2 and CO both zero). (There are, of course, many other assumptions, too numerous to list here.) The early kilns, often with low L/D, and with no heat exchangers to speak of, had much higher exit temperatures - up to 500°C, and would produce a correspondingly steeper curve.
The effect of carbon monoxide he overestimated by 60%. He seems to have had reasonably good enthalpy data on hand, and a full set of input parameters to work with, but he embarked upon what he calls a "somewhat elaborate calculation" presumably quite soon after he joined the project, and got in a terrible mess. Needless to say, there was no-one around capable of detecting his errors. It has to be said that, although the calculations performed are second nature to a modern process engineer, they are indeed extremely elaborate, considering the fact that the end result is a single coefficient, and required (for me) a long modelling spreadsheet involving recursive mathematics that, if expressed algebraically, would have been impossibly complex. Martin stumbled into error in trying to cut through the Gordian Knot of this calculation in longhand algebra. Suffice it to say that he gave the percentage relative increase in fuel consumption as 5.84 times the exhaust % CO content (v/v, dry basis). The actual factor is around 3.65, but varies considerably depending particularly on heat consumption - typically it's 3.14 + 3.24 / Q, where Q is in MJ/kg. It varies (somewhat less) with other parameters, such as coal rank, and is not quite linear with CO. The red curve is obtained by multiplying Martin's CO values by 3.65.
The resultant curve (green) demonstrates the "optimum" O2 content at around 1.1-1.2%. Because of the steepness of the CO/O2 relationship, major errors in the calculations had not much effect on the final result, and as instantaneous O2 values became available, most kilns were controlled around the 1% mark. In modern practice, the effect of CO is something of a moot point, since its presence in exhaust gases is rigorously avoided. Futhermore, because most modern kilns carry high recirculating loads of sulfur, it's normal to keep oxygen content at the rotary kiln exit (before the preheater) at 2% or more, in order to minimise the reductive decomposition of calcium sulfate. So most of the above is irrelevant to the modern industry, but this website is about history, and this topic in the 1920s was of make-or-break importance in the development of kilns.