It occurred to me that I ought to write a short text on this while compiling a large database of historical coal analysis data. This was needed in order to track regional variations in characteristics of coal used in the cement industry. Study of early literature on coal shows that understanding of the nature and constitution of British coal advanced rapidly in the early years of the twentieth century.
That "coalification" - transformation of initially woody materials into compositions progressively closer to pure carbon - was an evolutionary geological process was well understood by 1900. The state of knowledge of coal in 1907 is well-described in the article in the 11th edition of Encyclopaedia Britannica (online). Bernard Renault had pioneered the microscopical examination of coal and established the botany of plants involved in its formation. The fact that coalification is progressive was well-demonstrated by Seyler's Chart, first published in 1900, although it was as yet not sufficiently recognised to make it into the encyclopaedia article. This prompts me to digress on the subject of Seyler, who one would imagine to be an obscure functionary of BCURA, but turns out to be a rather fascinating person.
Seyler's Chart is well-known everywhere, although its originator is insufficiently remembered. Clarence Arthur Seyler (5/12/1866-24/7/1959) was born in Clapton, London to a middle class family. His sister became a famous actress. He was educated in chemistry at University College, London and the City & Guilds Technical College, and assisted William Crookes for a while after graduation. He then took the position of assistant to the Public Analyst for South-West Wales, and on the death of the latter in 1895, took over his position. Covering the counties of Pembrokeshire, Carmarthenshire, Glamorgan and the County Borough of Swansea, he was largely involved in investigation of the metallurgical and coal industries. He used the calorimetry techniques pioneered by Marcellin Berthelot to make the first accurate and systematic study of coal calorific value, while also performing precise elemental analyses.
A peculiar event occurred in 1900: an "epidemic" of arsenic poisoning among beer drinkers in northwest England. This led to investigation of the sources of arsenic, and although the main contamination of the beer was not directly attributed to coke, it was established that coke used in malting barley frequently contributed unacceptably high arsenic levels. Seyler, equipped with the nation's best coal laboratory, was able to show that West Wales anthracite was uniquely low in arsenic, and could be used with confidence instead of coke. This led to a brief period in which the tiny Pembrokeshire coalfield established a niche market for its product. So we find Seyler characterising coal as far as trace element level well before many regions were doing any systematic testing at all. Seyler was also uniquely placed in southwest Wales, because in that region, the upper ranked coals are found in a very distinct geographical distribution. Seyler had at his disposal an unusually wide range of distinctive coal samples, and correlation of their properties led him to draw up Seyler's Chart.
Seyler subsequently refined the process of coal characterisation, building on the petrological work of Marie Stopes. She devised the mineralogical division of coal into the lithotypes vitrain, clarain, durain and fusain during the period 1914-1919. Seyler further elaborated this by developing the technique of quantitative reflectance measurement still used in coal investigation today, publishing this in 1941. He continued as Public Analyst until 1942, when he moved to BCURA as head of Coal Systematics and Petrology. In addition to his unrivalled expertise in coal, his publications included learned papers on Welsh place-names and dialects, and on the Norse sagas.
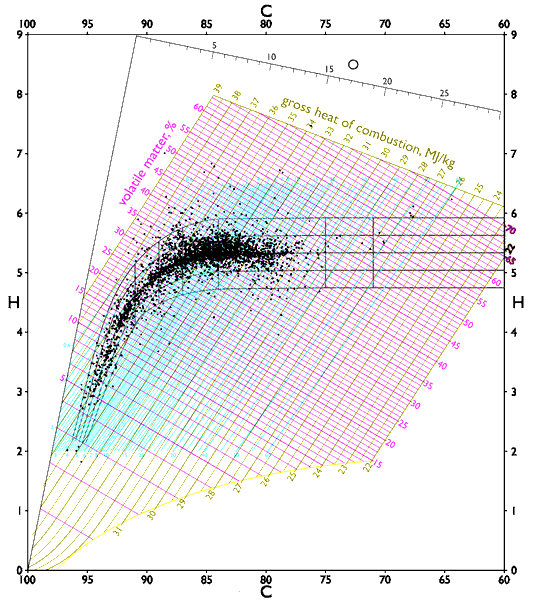
Seyler's Chart, revised many times, has become known by those involved in coal analysis world-wide. The underlying principle of the chart is that the carbon, hydrogen and volatile contents and the calorific value of the combustible part of the coal are inter-related, within a small margin of error, to the extent that, if two of these parameters are known, the other two can be deduced. More importantly, it shows that, at least for British Carboniferous coals, most coals when plotted on the chart are evenly distributed in a fairly narrow band, with lignites at one end and anthracites at the other. In this, it is rather similar to the Hertzsprung-Russell diagram, proving that each coal exhibits a particular stage in a continuous evolutionary process. The concept of rank can therefore be quantified in terms of distance along this "main group" line.
 View HD image in a new window.
The geometry of the line is such that for higher ranks, the volatile matter correlates well with rank, whereas in the lower rank part, the rank correlates best with calorific value. The ASTM standard classifies coal in this way, but many other approaches have been used. In the cement industry, only the volatile matter is of significance, and a simple ranking based on this is used in the article on coal.