The Ordnance Survey began its work in 1791 with the threat of French invasion. The increasing technical development of artillery ("ordnance") allowed ballistic trajectories of projectiles to be calculated and accurately aimed, but such calculations required an accurate knowledge of distances and altitudes. Accurate surveying to this end was already well advanced in France, and the Board of Ordnance was set up as an offshoot of the Royal Engineers in 1791. The first systematic surveys were performed in the southeast, and the first maps at 1:63360 scale were published for Kent in 1801. Maps at that scale were gradually extended over Britain, and were only complete in the 1870s. In the meantime, the need for mapping at a much larger scale became obvious. After a long period of deliberation, it was decided in 1858 that, for most of the country, mapping should be performed at 1:2500 scale, and all smaller-scale maps should be derived from these. Surveying at a suitable level of detail had already begun in 1853, and the first published 1:2500 maps - again, for Kent - were published in 1863. These were the "County Series" maps.
Each county was treated as a separate mapping project. Maps were made on a Cassini Projection, using a local meridian. This means that features of adjacent counties were not shown on the map. On attempting to fit adjacent county maps together jigsaw-fashion, it is found that their boundaries do not perfectly match if they employed different meridians. For instance, Kent used the Hollingbourne Hill meridian (longitude 0.66543° east) whereas Essex used the St Paul's Cathedral meridian (longitude 0.09677° west), so they render their common boundary differently. After WWII, these inconsistencies were eliminated by the formation of the National Grid maps, in which the whole of Britain is represented on a common Transverse Mercator projection based on the 2° west meridian. The National Grid system, particularly in combination with modern geolocation devices, allows survey points - for example in an archaeological survey - to be plotted accurately in an unambiguous manner. However, there remains the problem of correlating information from the historic County Series maps with modern surveys. The problem is exacerbated by the fact that the standard of surveying of the historic maps was subject to larger errors than encountered in modern mapping.
The first edition of the 1:2500 map of Northfleet was one of the first large scale maps published. The Northfleet waterfront is shown (unfortunately) on four separate sheets: Kent sheets X.01, X.02, X.05 and X.06. The fragmentary X.02 is rendered as an inset on X.06. All these were surveyed in 1863-4 and published in 1865. The maps are of interest because they show two of the world's earliest cement plants. The exact (i.e. ±1 metre or better) location of features shown on these maps is of great importance. I have made several attempts at superimposing these maps on the modern National Grid over the years, using maps obtainable online, always with indifferent results, by a "least-squares" fitting process. One problem is that relatively few features on the old maps have survived to be shown on National Grid maps, the cement plant areas having been frequently redeveloped. Another is that, although the old map is accurate on average, individual features are subject to random errors in terms of scale, location and orientation, so that correlation of the few common points is rather poor.
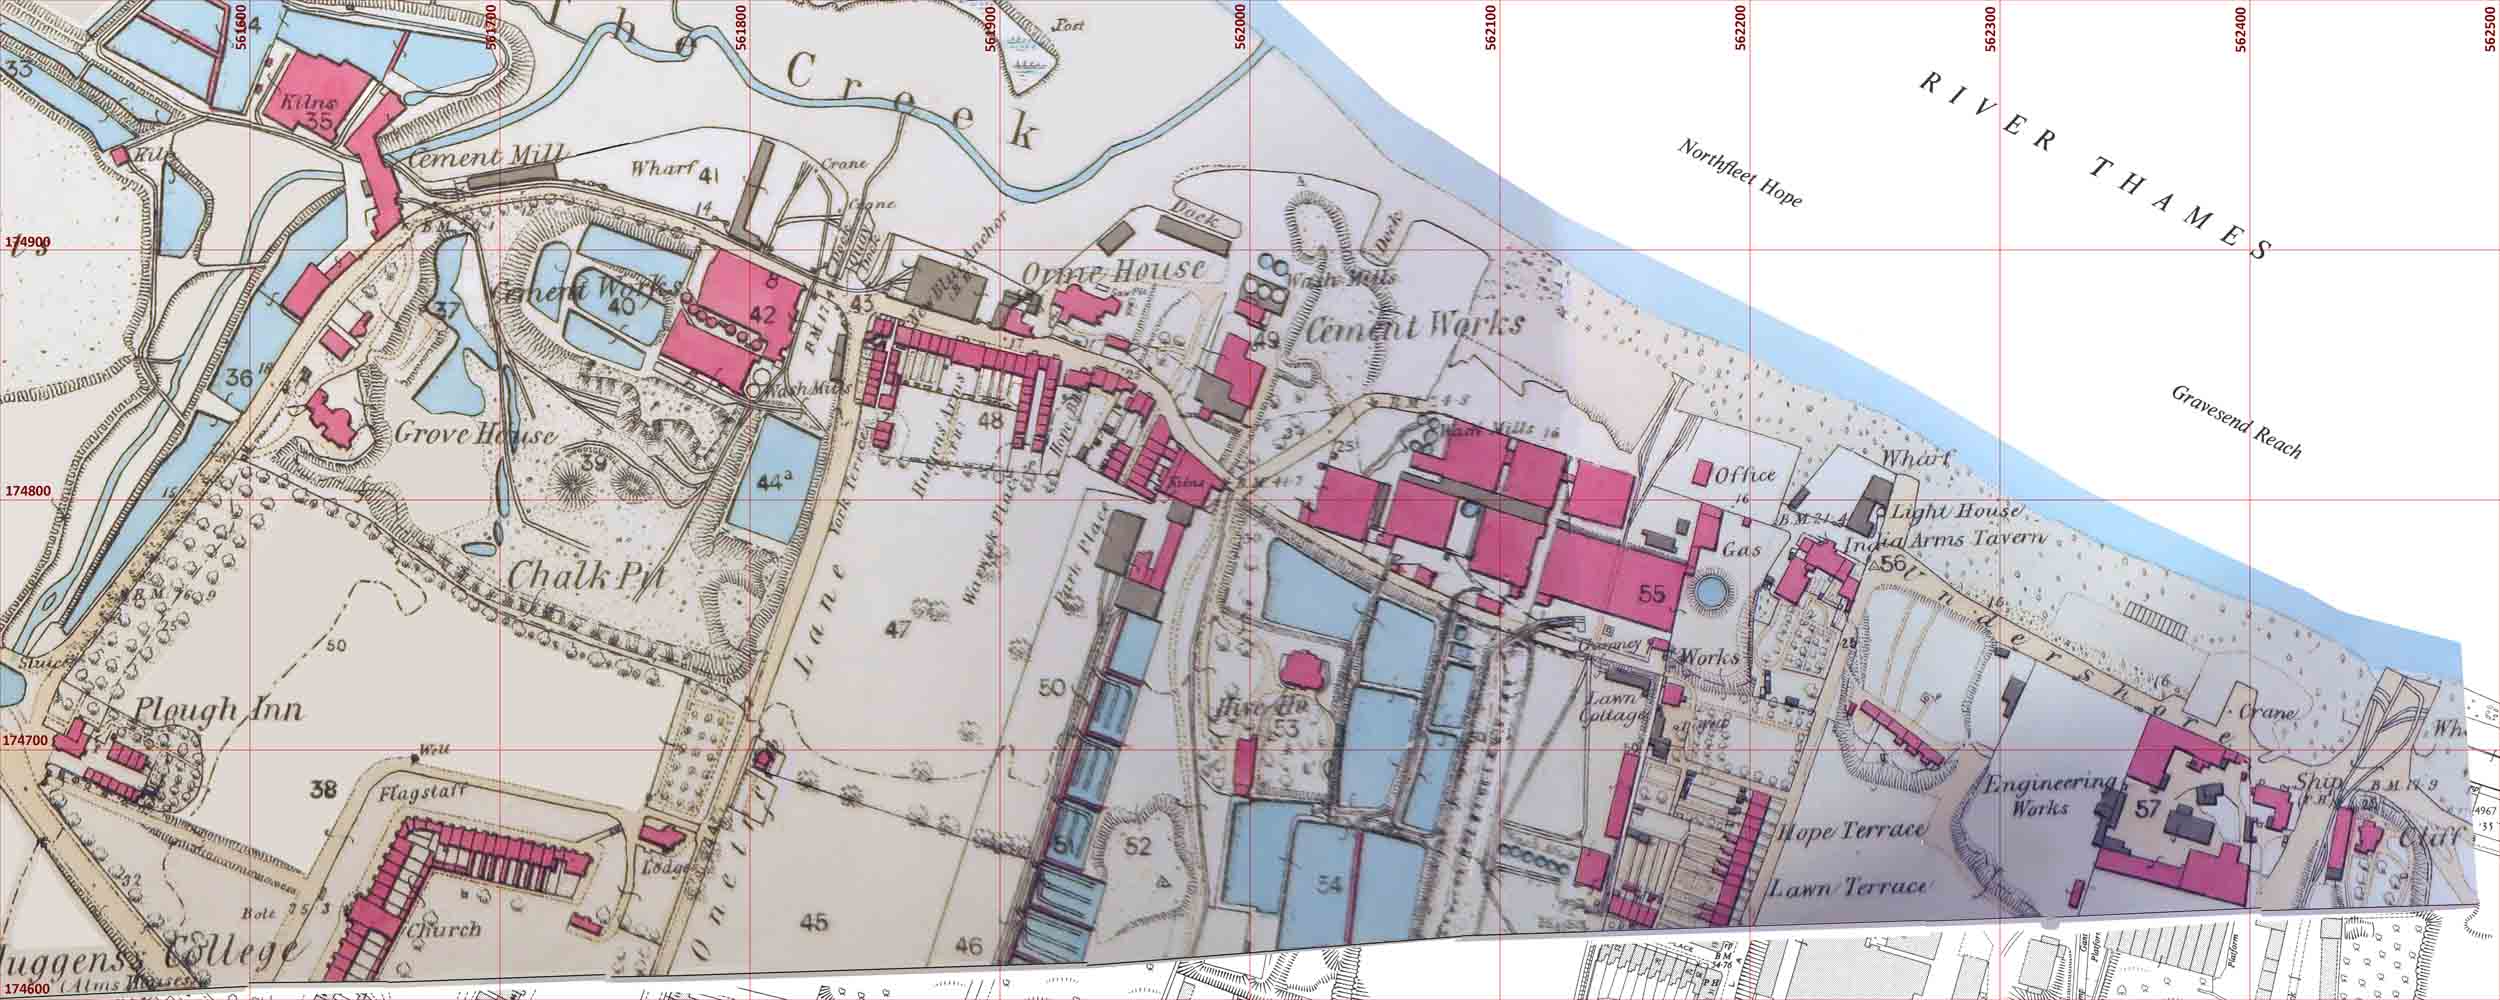
I decided (2022) to attempt a definitive rendition of sheets X.01 and X.02 (which contain most of the features of interest), to reduce uncertainties to a minimum. Online maps are either of poor quality (e.g. OldMaps, which are for purely decorative purposes) or not available at all. I used instead the original hand-coloured prints held by the British library, photographically copied and adjusted for distortion, and assembled into a single image file at 2px/ft scale. As a base for the National Grid, I used the 1:1250 map surveyed in August 1952. The area was fairly comprehensively surveyed after WWII, and locations were mostly retained without modification in later editions up to the present. A few features, as a result of poor aerial photography interpretation, are a bit out, but in general the map can be regarded as definitive, while still retaining a few early features. This map was rendered as an image at 10px/m scale. The 1863 map was then superimposed on this base in small fragments, stretched into their location by rubber-sheet fitting. The result is as follows:

View HD image in a new window. This map is designed for reading grid references of key features. For layout relationships, the original map is preferable.